Threat Hunting guide
The Threat Hunting feature acts as a dashboard that enables admins to pinpoint anomalies in device settings and behavior. Its primary objective is to identify security breaches proactively, ensuring threats are detected before they manifest their potential malicious behavior. This feature is available for all workspaces using Enterprise Security +EDR.
To simplify the process of threat hunting for our users, we included several pre-defined queries. You can still add user-defined queries to match your needs.
Common queries and when to use them
A common query is a predefined set of instructions or criteria used to search and analyze data in a system, helping identify specific information or patterns from a dataset or database. It can vary based on the specific goals of the analysis, such as filtering data, checking system information, or simply extracting meaningful insights from the dataset.
The choice of common queries will depend on the specific analytical objectives, the characteristics of the dataset, and the insights you are seeking to gain from the data. Understanding the nature of your data and the questions you want to answer will guide the selection of appropriate queries for your analysis.
Running Queries on-demand and asynchronous
Live query:
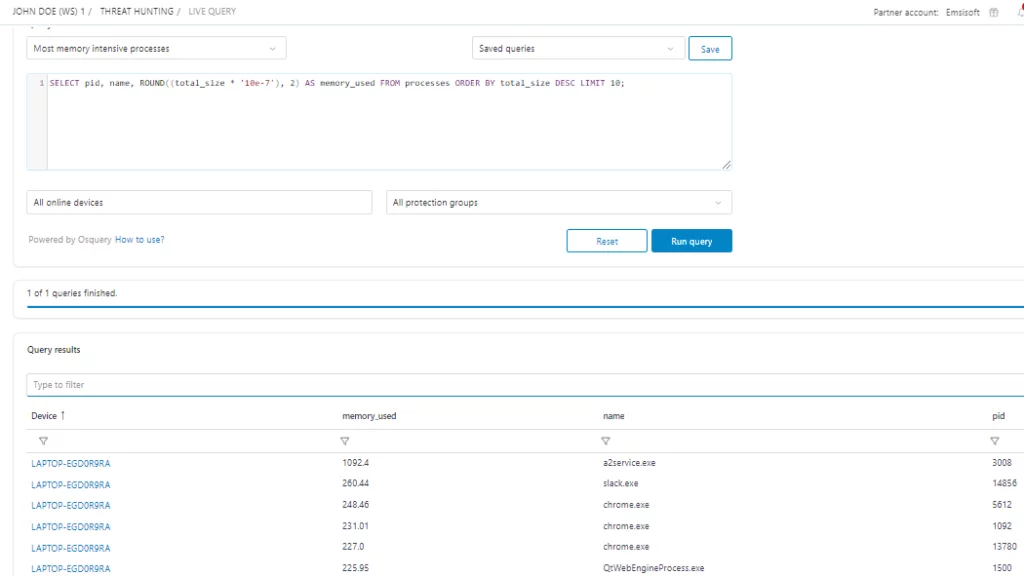
Live queries – or on-demand queries – are suitable when immediate, up-to-the-moment data is crucial, and suitable for tasks that are quick to execute and return results.
Running a query on-demand enables real-time result viewing within your dashboard. This flexible query tool allows us to examine all selected devices and promptly display the results right below.
Asynchronous queries and reports:
When running asynchronous queries, they operate independently of the main program flow, and their execution does not depend on the immediate completion of other tasks. It allows Admins to check reports later while editing different reports in real-time.
Asynchronous queries are beneficial for tasks that take longer to execute, common in scenarios where the user experience is not compromised by waiting for the result. Ideal when dealing with tasks that can be performed concurrently or when non-blocking behavior is crucial.
The Snapshots represent a complete copy of a report instead of displaying it in the live results view. It can be seen on the Reports panel.
Please note that certain queries might take a while to return results. Admins have the option to click a Cancel Query button to stop execution.
Create a new report and start analyzing using common queries
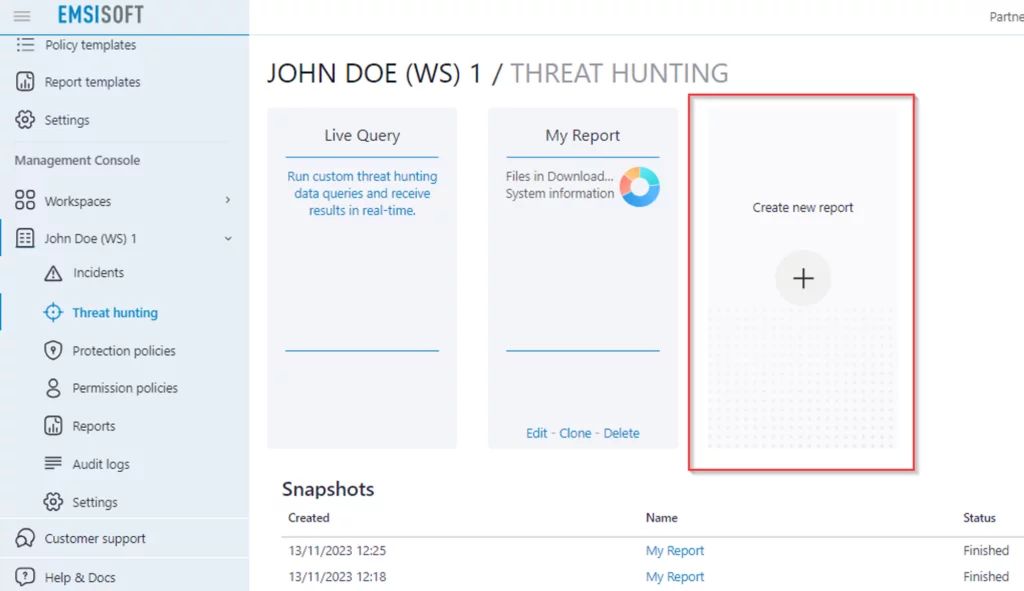
- At your Emsisoft Management Console, select an existing Workspace, click on Threat Hunting and Create new report.
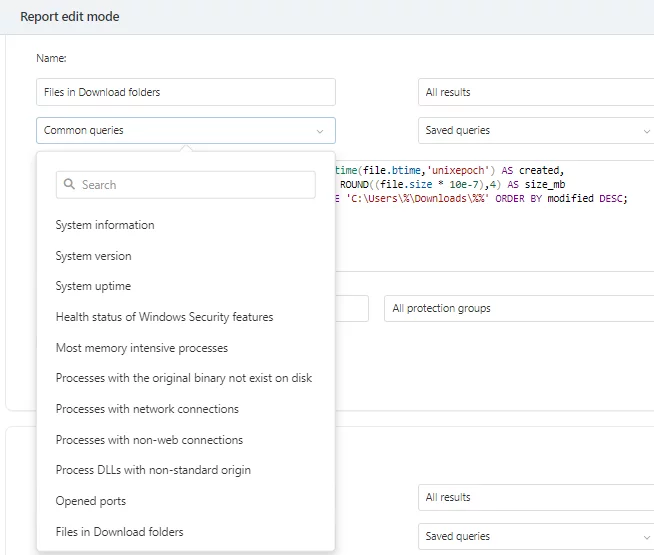
- Click on the Edit Report button to handle your Queries settings and initiate report runs.
- Create an automated security system by scheduling your reports daily, weekly, or monthly.
- Explore and select from the list of pre-defined common queries for a more effective approach to threat hunting.
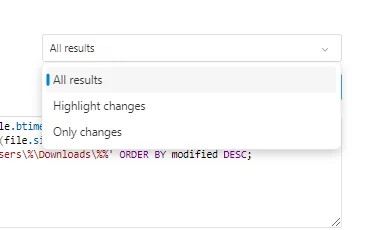
- Choose either to show the full dataset or just the changes from previous runs on your dashboard. This feature enhances efficient alerting for potentially malicious system modifications. This setting can be modified in View mode to see other results if needed.
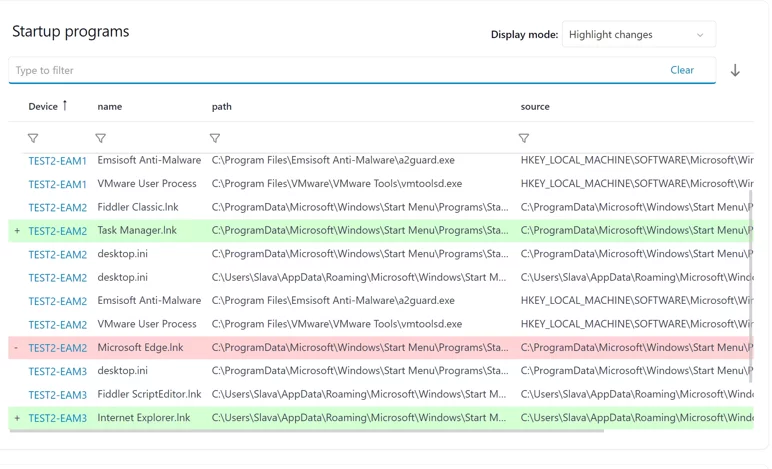
Opting for Highlight changes brings a user-friendly touch to your data analysis. Here, GREEN steers you toward modified or added data, while RED signals the removal of previously existing data from the device. This color-coded system simplifies the process of quickly spotting and understanding alterations.
Threat Hunting within the Incidents Panel
The Alert Changes checkbox specifies whether any detected changes in query results from the previous run, and it shall trigger an event in the incidents list, email notifications, and integrations.
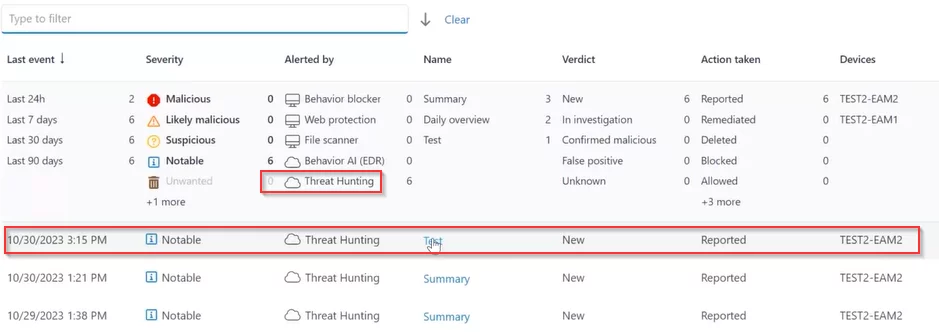
Whenever a modification in a hostfile is identified, the alteration will be emphasized in the reports dashboard, and an event will be triggered in the Incidents panel overview.
Simply click on the detection from the Incidents panel, and a Snapshot will open in the Only Changes mode, providing a complete copy of the report.
Handling unexpected errors
While executing queries on a set of devices, if one of the devices encounters an issue and doesn’t respond, the system will promptly generate a notification on the dashboard stating View 1 error.
This button will specifically identify the problematic device and provide details about the query that was in progress at the time of the occurrence.
Here is the example of what happens once clicked:
If some devices are offline while creating asynchronous or scheduled snapshots, we’ll wait for one hour just in case these devices come online again. This ensures they can be included in the report.
Behind the Query execution logic
Imagine your database as a giant library, and your query is like asking the librarian to find specific books. The database engine, acting as the librarian, follows these steps:
- Understanding the Query: The librarian first understands your question (query) to figure out which books (data) you’re looking for.
- Query Parsing: Next, the librarian breaks down your question into smaller parts, like identifying keywords and conditions in your query.
- Query Optimization: Just as the librarian might choose the best route to collect books efficiently, the database engine optimizes the query execution plan to fetch data most effectively.
- Data Retrieval: Now, the librarian goes through the shelves, fetching the books (data) that match your criteria.
- Result Presentation: Finally, the librarian hands you the books, neatly organized according to your query. Similarly, the database engine presents the queried data in a readable format.
Understanding the logic behind query execution helps ensure a speedy and accurate retrieval of information from the database.
Need help or have questions?
Our customer support team is always here to help. If you have any questions about these changes or need assistance with managing your licenses, please don’t hesitate to contact us.
